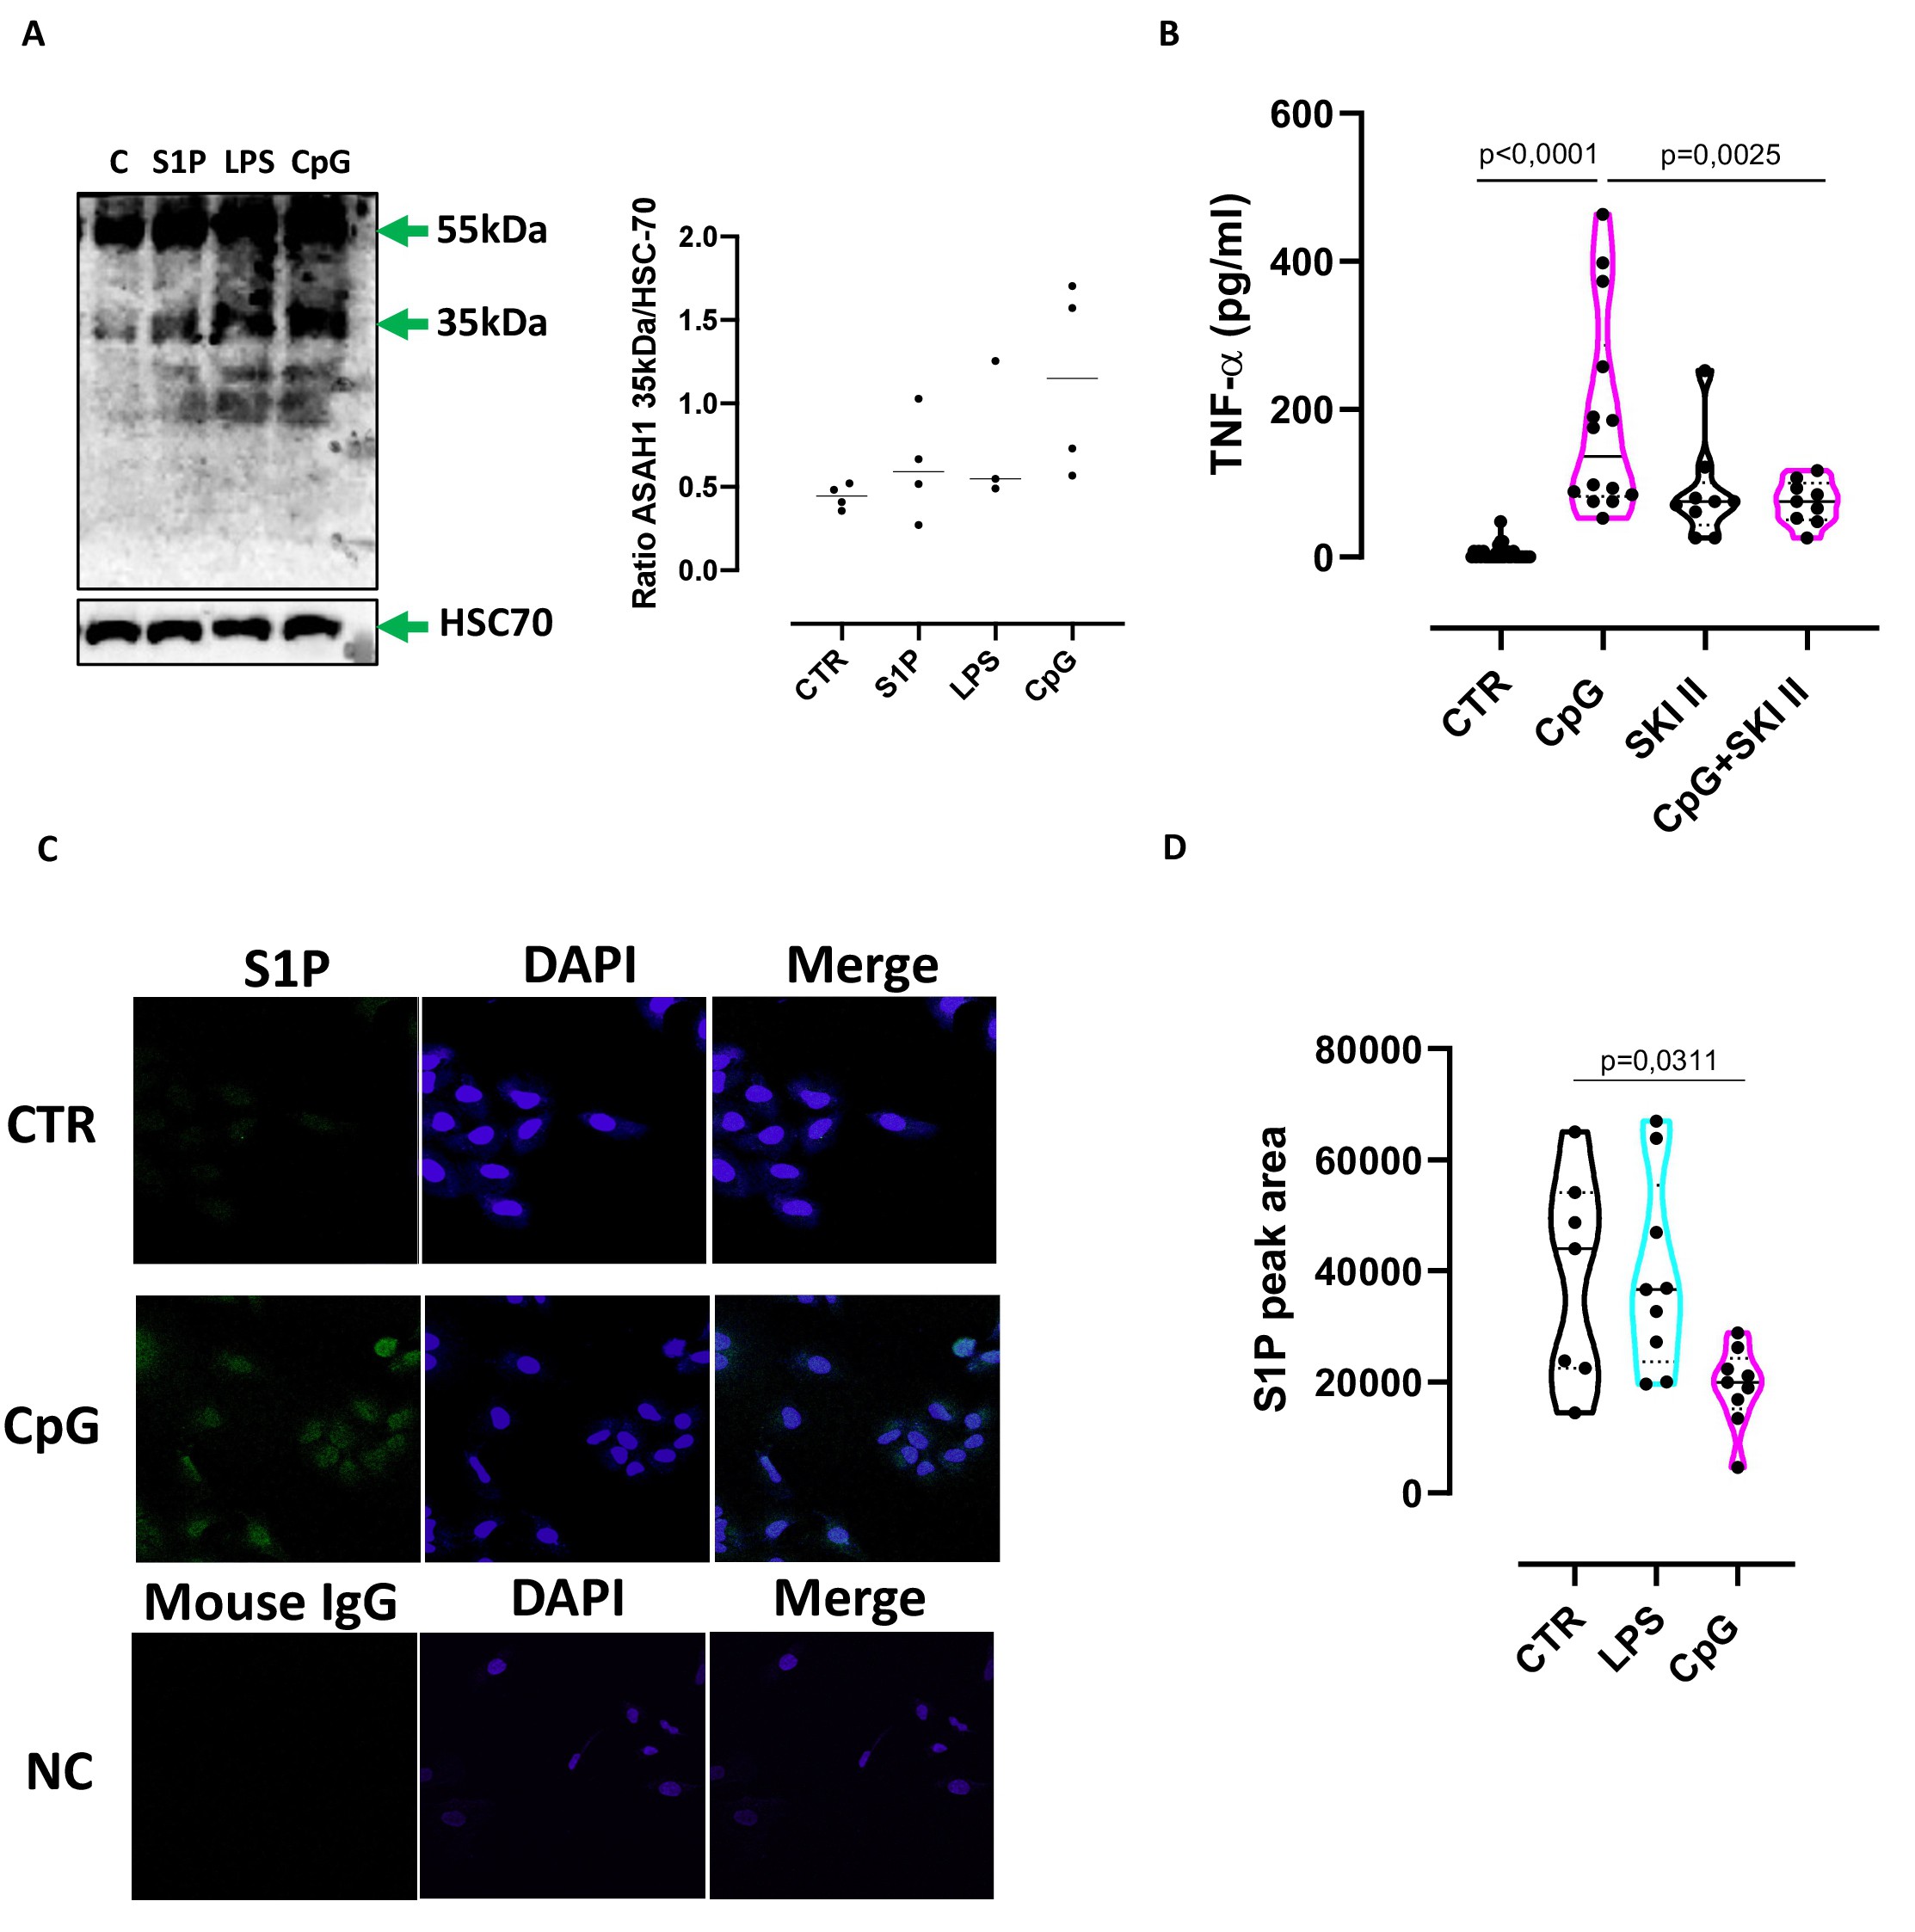
Fig. 2. CpG signaling alters S1P metabolism. Lung adenocarcinoma A549 cells were stimulated with TLR9 ligand, CpG 1 µg/ml for 3 hours. A) Western blotting analysis show that CpG 1 µg/ml 3 hours treated A549 cells express high levels of ceramidase active form (35kDa) compared to control and S1P 10 nM- or LPS 0,1 µg/ml-stimulated cells. HSC70 was used as loading protein. Densitometric analysis is shown. B) TNF-α release from 8 hours-treated A549 was significantly reduced when SPHKs were inhibited by means of SKI II, in presence of CpG. C) Immunofluorescence analysis show S1P overexpression after CpG treatment compared to control; negative control (NC) was also shown. D) LC-MS/MS experiment show that the levels of S1P in cell lysates (expressed as S1P peak area) were reduced after 3 hours of CpG treatment compared to control and LPS-stimulated cells. Data are presented as violin plot, showing the median ± interquartile range. Statistical differences were assessed with Ordinary ONE-Way ANOVA followed by Tukey's multiple comparison test. SKI I/II, selective inhibitor of sphingosine kinases (SKI I/II 10 µM).